


Python专区 加入小组
全国院线总票房破50亿!影院复工后,哪些电影最受欢迎?文章代码
影院复工数据分析
# 导入包
import numpy as np
import pandas as pd

from pyecharts.charts import Bar, Map, Line, Page
from pyecharts import options as opts
from pyecharts.globals import SymbolType, WarningType
WarningType.ShowWarning = False
影院复工地图-淘票票
复工率Top5省份
df_1 = pd.read_csv('../data/淘票票复工率Top5省份0827.csv')
df_1 = df_1.sort_values('openCinemaRate')
df_1
| boxOffice | boxOfficeStr | cityId | cityName | openCinemaCnt | openCinemaCntStr | openCinemaIncrCnt | openCinemaIncrCntStr | openCinemaRate | openCinemaRateStr | scheduleCnt | scheduleCntStr | showDate | soldSeatCnt | soldSeatCntStr | |
|---|---|---|---|---|---|---|---|---|---|---|---|---|---|---|---|
| 4 | 59522139 | 59.5万 | 999929 | 青海省 | 41 | 41 | 0 | 0 | 0.953 | 95.3% | 1000 | 1000 | 20200827 | 16906 | 1.69万 |
| 3 | 970996899 | 971.0万 | 999916 | 河南省 | 510 | 510 | 0 | 0 | 0.964 | 96.4% | 15119 | 1.51万 | 20200827 | 289174 | 28.92万 |
| 2 | 540238952 | 540.2万 | 999914 | 江西省 | 334 | 334 | -5 | -5 | 0.965 | 96.5% | 7198 | 7198 | 20200827 | 158912 | 15.89万 |
| 1 | 370686517 | 370.7万 | 999920 | 广西 | 258 | 258 | 1 | 1 | 0.985 | 98.5% | 5581 | 5581 | 20200827 | 104000 | 10.40万 |
| 0 | 27058030 | 27.1万 | 999926 | 西藏 | 23 | 23 | 1 | 1 | 1.000 | 100.0% | 409 | 409 | 20200827 | 6764 | 6764 |
# 产生数据
x_data = df_1['cityName'].values.tolist()
y_data = [float(i.split('%')[0]) for i in df_1['openCinemaRateStr'].values.tolist()]

# 条形图
bar1 = Bar(init_opts=opts.InitOpts(width='1350px', height='750px'))
bar1.add_xaxis(x_data)
bar1.add_yaxis('', y_data, category_gap='50%')
bar1.set_global_opts(title_opts=opts.TitleOpts(title='全国复工率Top5省份(8-27)'))
bar1.set_series_opts(label_opts=opts.LabelOpts(is_show=True, position='right'))
bar1.set_colors('#F6A061')
bar1.reversal_axis()
bar1.render()
'C:\\Users\\wzd\\Desktop\\CDA\\CDA_Python\\Python项目实作\\网络爬虫\\电影\\电影复工分析\\code\\render.html'
全国影院复工地图
df_2 = pd.read_csv('../data/淘票票各省票房-0827.csv')

# 城市数据
df_2['cityName'] = df_2['cityName'].str.replace('市', '').str.replace('省', '')
df_2.head()
| boxOffice | boxOfficeStr | cityId | cityName | openCinemaCnt | openCinemaCntStr | openCinemaIncrCnt | openCinemaIncrCntStr | openCinemaRate | openCinemaRateStr | scheduleCnt | scheduleCntStr | showDate | soldSeatCnt | soldSeatCntStr | |
|---|---|---|---|---|---|---|---|---|---|---|---|---|---|---|---|
| 0 | 571133208 | 571.1万 | 99991 | 北京 | 206 | 206 | 3 | 3 | 0.866 | 86.6% | 5729 | 5729 | 20200827 | 115052 | 11.51万 |
| 1 | 220772644 | 220.8万 | 99992 | 天津 | 90 | 90 | 0 | 0 | 0.833 | 83.3% | 2636 | 2636 | 20200827 | 57467 | 5.75万 |
| 2 | 636961140 | 637.0万 | 99993 | 河北 | 384 | 384 | -3 | -3 | 0.901 | 90.1% | 9807 | 9807 | 20200827 | 180247 | 18.02万 |
| 3 | 364804000 | 364.8万 | 99994 | 山西 | 264 | 264 | -4 | -4 | 0.917 | 91.7% | 6163 | 6163 | 20200827 | 103178 | 10.32万 |
| 4 | 241007410 | 241.0万 | 99995 | 内蒙古 | 186 | 186 | -7 | -7 | 0.842 | 84.2% | 4207 | 4207 | 20200827 | 68254 | 6.83万 |
open_num = df_2[['cityName', 'openCinemaCnt']]
open_num.head()
| cityName | openCinemaCnt | |
|---|---|---|
| 0 | 北京 | 206 |
| 1 | 天津 | 90 |
| 2 | 河北 | 384 |
| 3 | 山西 | 264 |
| 4 | 内蒙古 | 186 |
x_data = open_num.cityName.values.tolist()
y_data = open_num.openCinemaCnt.values.tolist()

# 地图
map1 = Map(init_opts=opts.InitOpts(width='1350px', height='750px'))
map1.add("", [list(z) for z in zip(x_data, y_data)],
         maptype='china'
        )
map1.set_global_opts(title_opts=opts.TitleOpts(title='全国影院复工数地图(8-27)'),
                     visualmap_opts=opts.VisualMapOpts(max_=open_num.openCinemaCnt.max(),
                                                       is_piecewise=True,
#                                                        pieces=
                                                      ),
                    )
map1.render()
'C:\\Users\\wzd\\Desktop\\CDA\\CDA_Python\\Python项目实作\\网络爬虫\\电影\\电影复工分析\\code\\render.html'
全国影院复工数Top10
num_top10 = open_num.sort_values('openCinemaCnt', ascending=False).head(10)
num_top10
| cityName | openCinemaCnt | |
|---|---|---|
| 18 | 广东 | 1092 |
| 9 | 江苏 | 813 |
| 10 | 浙江 | 663 |
| 22 | 四川 | 564 |
| 14 | 山东 | 517 |
| 15 | 河南 | 510 |
| 17 | 湖南 | 405 |
| 2 | 河北 | 384 |
| 16 | 湖北 | 374 |
| 11 | 安徽 | 363 |
x_data = num_top10.cityName.values.tolist()
y_data = num_top10.openCinemaCnt.values.tolist()

# 条形图
bar2 = Bar(init_opts=opts.InitOpts(width='1350px', height='750px'))
bar2.add_xaxis(x_data)
bar2.add_yaxis('', y_data)
bar2.set_global_opts(title_opts=opts.TitleOpts(title='全国影院复工数Top10省份(8-27日)'),
#                      xaxis_opts=opts.AxisOpts(axislabel_opts=opts.LabelOpts(rotate=-15)),
                     visualmap_opts=opts.VisualMapOpts(is_show=False, max_=1092)
                    )
bar2.render()
'C:\\Users\\wzd\\Desktop\\CDA\\CDA_Python\\Python项目实作\\网络爬虫\\电影\\电影复工分析\\code\\render.html'
| boxOffice | boxOfficeStr | cityId | cityName | openCinemaCnt | openCinemaCntStr | openCinemaIncrCnt | openCinemaIncrCntStr | openCinemaRate | openCinemaRateStr | scheduleCnt | scheduleCntStr | showDate | soldSeatCnt | soldSeatCntStr | |
|---|---|---|---|---|---|---|---|---|---|---|---|---|---|---|---|
| 0 | 422155895 | 422.2万 | -5 | 全国 | 1397 | 1397 | 1009 | 1009 | 0.129 | 12.9% | 12599 | 1.26万 | 20200720 | 164716 | 16.47万 |
| 1 | 537683369 | 537.7万 | -5 | 全国 | 2040 | 2040 | 643 | 643 | 0.189 | 18.9% | 23482 | 2.35万 | 20200721 | 215780 | 21.58万 |
| 2 | 644860406 | 644.9万 | -5 | 全国 | 2567 | 2567 | 527 | 527 | 0.237 | 23.7% | 35414 | 3.54万 | 20200722 | 274121 | 27.41万 |
| 3 | 662853406 | 662.9万 | -5 | 全国 | 3152 | 3152 | 585 | 585 | 0.291 | 29.1% | 46315 | 4.63万 | 20200723 | 309331 | 30.93万 |
| 4 | 2030300376 | 2030.3万 | -5 | 全国 | 4670 | 4670 | 1518 | 1518 | 0.432 | 43.2% | 83543 | 8.35万 | 20200724 | 757934 | 75.79万 |
df_3.info()
<class 'pandas.core.frame.DataFrame'>
RangeIndex: 39 entries, 0 to 38
Data columns (total 15 columns):
 #   Column                Non-Null Count  Dtype
---  ------                --------------  -----
 0   boxOffice             39 non-null     int64
 1   boxOfficeStr          39 non-null     object
 2   cityId                39 non-null     int64
 3   cityName              39 non-null     object
 4   openCinemaCnt         39 non-null     int64
 5   openCinemaCntStr      39 non-null     int64
 6   openCinemaIncrCnt     39 non-null     int64
 7   openCinemaIncrCntStr  39 non-null     int64
 8   openCinemaRate        39 non-null     float64
 9   openCinemaRateStr     39 non-null     object
 10  scheduleCnt           39 non-null     int64
 11  scheduleCntStr        39 non-null     object
 12  showDate              39 non-null     int64
 13  soldSeatCnt           39 non-null     int64
 14  soldSeatCntStr        39 non-null     object
dtypes: float64(1), int64(9), object(5)
memory usage: 4.7+ KB
 复工后票房数据.zip
6回复
-

df_3['box_num'] = df_3.boxOfficeStr.str.extract(r'(\d+\.\d+)').astype('float')
df_3['box_unit'] = df_3.boxOfficeStr.str.extract(r'([\u4e00-\u9fa5]+)').replace({'万': 10000, '亿': 100000000})
df_3['true_box'] = df_3['box_num'] * df_3['box_unit']
df_3['true_box'] = df_3['true_box'] / 10000
df_3.drop(['box_num', 'box_unit'], axis=1, inplace=True)
df_3.head()
boxOffice boxOfficeStr cityId cityName openCinemaCnt openCinemaCntStr openCinemaIncrCnt openCinemaIncrCntStr openCinemaRate openCinemaRateStr scheduleCnt scheduleCntStr showDate soldSeatCnt soldSeatCntStr true_box 0 422155895 422.2万 -5 全国 1397 1397 1009 1009 0.129 12.9% 12599 1.26万 20200720 164716 16.47万 422.2 1 537683369 537.7万 -5 全国 2040 2040 643 643 0.189 18.9% 23482 2.35万 20200721 215780 21.58万 537.7 2 644860406 644.9万 -5 全国 2567 2567 527 527 0.237 23.7% 35414 3.54万 20200722 274121 27.41万 644.9 3 662853406 662.9万 -5 全国 3152 3152 585 585 0.291 29.1% 46315 4.63万 20200723 309331 30.93万 662.9 4 2030300376 2030.3万 -5 全国 4670 4670 1518 1518 0.432 43.2% 83543 8.35万 20200724 757934 75.79万 2030.3 -
x_data = open_trend['showDate'].astype('str').str[-4:-2] + '-' + df_3['showDate'].astype('str').str[-2:]
x_data = x_data.values.tolist()
y_data = open_trend.openCinemaCnt.values.tolist()
line2 = Line(init_opts=opts.InitOpts(width='1350px', height='750px')) line2.add_xaxis(x_data) line2.add_yaxis('', y_data, markpoint_opts=opts.MarkPointOpts(data=[opts.MarkPointItem(type_="min"), opts.MarkPointItem(type_="max")]), # areastyle_opts=opts.AreaStyleOpts(opacity=0.5, color="#C67570"), ) line2.set_global_opts(title_opts=opts.TitleOpts(title='全国影院复工趋势图'), xaxis_opts=opts.AxisOpts(axislabel_opts=opts.LabelOpts(rotate='30')), yaxis_opts=opts.AxisOpts(name='', type_='value', axislabel_opts=opts.LabelOpts(formatter="{value}")) ) line2.set_series_opts(label_opts=opts.LabelOpts(is_show=False), linestyle_opts=opts.LineStyleOpts(width=3) ) line2.render()'C:\\Users\\wzd\\Desktop\\CDA\\CDA_Python\\Python项目实作\\网络爬虫\\电影\\电影复工分析\\code\\render.html'
-
猫眼电影票房分析
复工以来不同影片累计票房排名 前十
df_4 = pd.read_csv('../data/猫眼20200720-0827.csv')
df_4.head()
movieName releaseInfo sumBoxDesc boxSplitUnit boxRate showCount showCountRate avgShowView avgSeatView select_date 0 第一次的离别 上映首日 154.1万 152.12万 36.0% 3392 26.9% 17 13.8% 2020-07-20 1 误杀 NaN 12.07亿 60.58万 14.3% 1240 9.8% 19 20.5% 2020-07-20 2 哪吒之魔童降世 NaN 50.13亿 57.40万 13.5% 716 5.6% 17 10.9% 2020-07-20 3 寻梦环游记 NaN 12.12亿 42.55万 10.0% 896 7.1% 21 13.4% 2020-07-20 4 白蛇:缘起 NaN 4.55亿 23.21万 5.4% 340 2.6% 20 17.8% 2020-07-20 -
 # 计算单日票房
df_4['box_num'] = df_4.boxSplitUnit.str.extract(r'(\d+\.\d+)').astype('float')
df_4['box_unit'] = df_4.boxSplitUnit.str.extract(r'([\u4e00-\u9fa5]+)').replace({'万': 10000, '亿': 100000000})
df_4['unit_box'] = df_4['box_num'] * df_4['box_unit']
df_4.drop(['box_num', 'box_unit'], axis=1, inplace=True)
df_4.head()
movieName releaseInfo sumBoxDesc boxSplitUnit boxRate showCount showCountRate avgShowView avgSeatView select_date unit_box 0 第一次的离别 上映首日 154.1万 152.12万 36.0% 3392 26.9% 17 13.8% 2020-07-20 1521200.0 1 误杀 NaN 12.07亿 60.58万 14.3% 1240 9.8% 19 20.5% 2020-07-20 605800.0 2 哪吒之魔童降世 NaN 50.13亿 57.40万 13.5% 716 5.6% 17 10.9% 2020-07-20 574000.0 3 寻梦环游记 NaN 12.12亿 42.55万 10.0% 896 7.1% 21 13.4% 2020-07-20 425500.0 4 白蛇:缘起 NaN 4.55亿 23.21万 5.4% 340 2.6% 20 17.8% 2020-07-20 232100.0 -
df_sumbox = pd.DataFrame()

for name in df_4.movieName.drop_duplicates():
    # 计算累加
    df_onemovie = df_4[df_4['movieName'] == name][['movieName', 'select_date', 'unit_box']]
    df_onemovie['cum_box'] = df_onemovie.unit_box.cumsum()
    # 追加
    df_sumbox = df_sumbox.append(df_onemovie, ignore_index=True)
df_sumbox.head()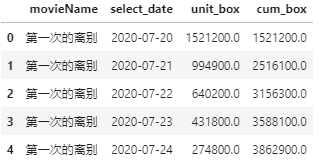
# 复制一份
df_sumbox2 = df_sumbox.copy()
# 筛选日期 df_sumbox = df_sumbox[df_sumbox['select_date'] == '2020-08-27'] df_sumbox.head()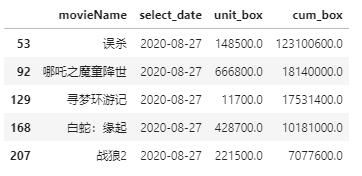
df_sumbox.loc[:, '累计票房(万)'] = (df_sumbox['cum_box'].copy() / 10000)
df_sumbox.head()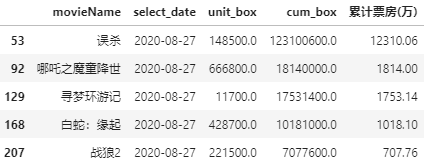
box_top10 = df_sumbox.sort_values('cum_box', ascending=False)
box_top10 = box_top10.head(10)
box_top10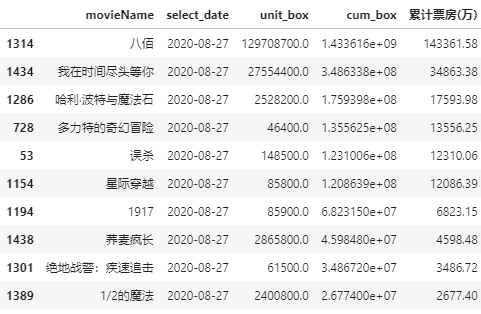
x_data = box_top10.movieName.values.tolist()
y_data = box_top10['累计票房(万)'].values.tolist()

# 条形图
bar3 = Bar(init_opts=opts.InitOpts(width='1350px', height='750px'))
bar3.add_xaxis(x_data)
bar3.add_yaxis('', y_data)
bar3.set_global_opts(title_opts=opts.TitleOpts(title='复工以来影片累计票房排名Top10'),
                     xaxis_opts=opts.AxisOpts(axislabel_opts=opts.LabelOpts(rotate=-15)),
                     yaxis_opts=opts.AxisOpts(name='', type_='value',
                                              axislabel_opts=opts.LabelOpts(formatter="{value}万")),
                     visualmap_opts=opts.VisualMapOpts(is_show=False, max_=143361.58)
                    )
bar3.render()
'C:\\Users\\wzd\\Desktop\\CDA\\CDA_Python\\Python项目实作\\网络爬虫\\电影\\电影复工分析\\code\\render.html'
-
影院复工后累计票房动图
df_sumbox2['cum_box'] = df_sumbox2['cum_box']/10000
df_sumbox2.head()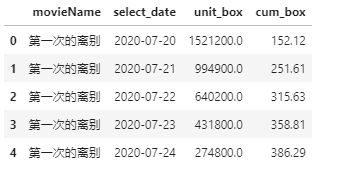
df_dongtu = pd.pivot_table(data=df_sumbox2, values='cum_box', index='movieName',
                           columns='select_date', aggfunc='sum')
df_dongtu = df_dongtu.reset_index()
df_dongtu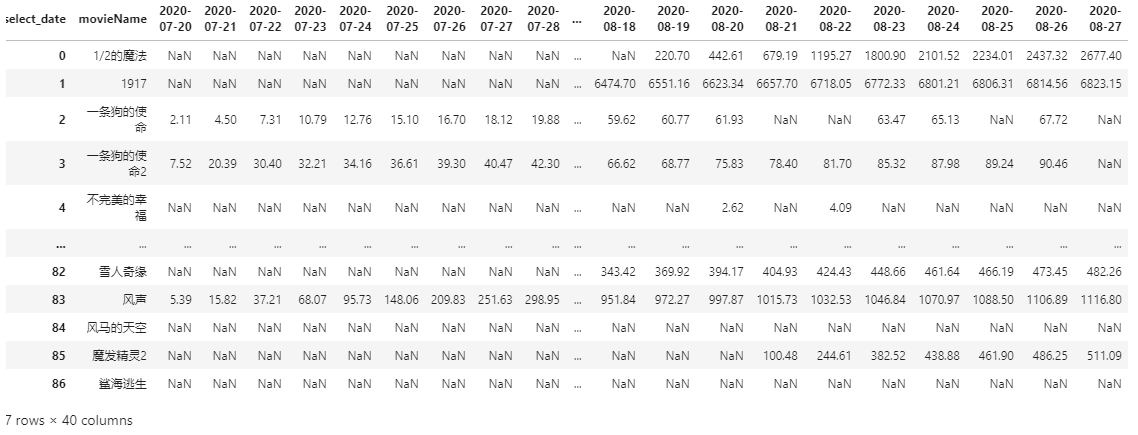
df_dongtu.to_excel('../data/复工动图数据.xlsx', index=False)# import plotly as py # import plotly.graph_objs as go # import plotly.express as px # from plotly import tools # # 条形图 # fig1 = px.bar(df_sumbox2, x='movieName', y='cum_box', color='movieName', text='cum_box', # title=' 影院复工后累计票房动图', # animation_frame='select_date', # range_y=[0, 143361.58], # # orientation='v' # ) # fig1.update_layout(xaxis_title='影片', yaxis_title='累计票房(万)') # py.offline.plot(fig1, filename=' 影院复工后累计票房动图.html')' 影院复工后累计票房动图.html'
px.bar_polar()生成page
page = Page()page.add(bar1, map1, bar2, line2, line1, bar3, bar4) page.render('电影复工数据分析.html')'C:\\Users\\wzd\\Desktop\\CDA\\CDA_Python\\Python项目实作\\网络爬虫\\电影\\电影复工分析\\code\\电影复工数据分析.html'

CDA考证

官网微信
